.png "Return Home")
Key Takeaways from the 2026 Vermont General Election
Key Takeaways:
-
Déjà vu: Tuesday’s results closely mirror the results of the 2018 election: Vermont saw a similar “blue wave” effect, giving the Democratic/Progressive coalition a supermajority and electing Scott by a similar margin of victory.
-
Enthusiasm Gap: While turnout was ~16% lower than 2024, the Democratic voter base saw only a modest increase in turnout, while the Republican voter base turnout cratered with a disproportionate (25%–35%) contraction relative to 2024.
-
Missed Opportunity: This week has some asking if a Democrats could have won the Gubernatorial race if they selected a more moderate candidate. Janoo's economic platform gave moderate Democrats and Independents pause, while Scott’s personal brand on affordability was strong enough to survive national headwinds. While his margin compressed, his personal brand outpaced down-ballot party performance.
- Super Majority, Not a Super Mandate: While pundits will differ, given the national blue wave, the toxicity of the national Republican label resulting in lower Republican base turnout and less ticket splitting, as well as the historical precedent, it is safe to say;
-
The Democratic Party is not entering the legislative session with a strong electoral mandate at the Vermont state level, and
-
The Governor’s survival suggests his mandate prevailed despite a Democratic supermajority compromising his ability to deliver.
-
Big picture: voters preserved Scott as an executive check on taxation and spending, while empowering the legislature with a veto-proof majority as an operational tool to enact policy independently.
-
-
Icarus learned their lesson? The Democratic Party advanced many priorities when they last had a supermajority, which led to significant Republican gains. To quote Peter Welch in a recent interview, “A word of caution to my democratic colleagues: Trump lost; we didn’t win.”
“Vote blue, No Matter Who…” (Except Janoo)
Tuesday night saw a massive blue wave nationally, extending into the Vermont state legislature. Scott’s personal coalition survived national and state-level headwinds to elect him to a historic and unprecedented sixth gubernatorial term; however, his coattails evaporated, resulting in the return of a Democratic Supermajority.
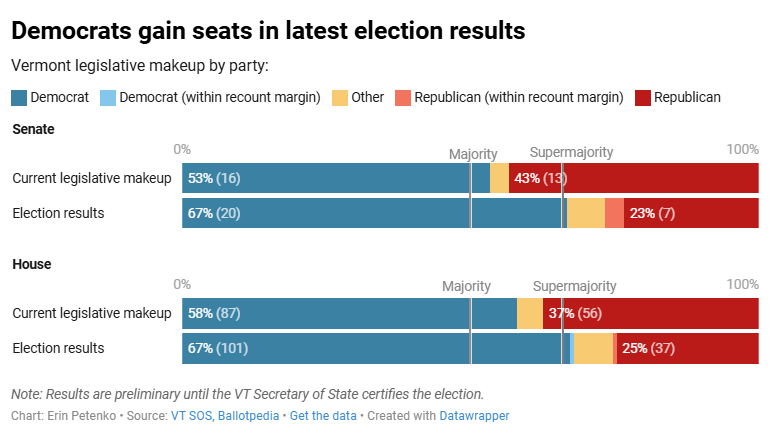
While the night seems extraordinary, to the seasoned Vermont political observer, it feels like you’ve seen it before.
2018 | 2026 | Key Differences | |
Senate | 24 seats (22 D + 2 P) | 22 seats (20 D + 1 P/D, +1 Independent) | Comparable supermajority strength, but with individual seat shifts in Rutland and Addison districts. |
House | 102 seats (95 D + 7 P) | 109 seats (102 D + 6 P + 1 I) 2 I go to Rs | The Democrats achieved a supermajority without the progressives and won by a wider margin than in 2018. |
Gubernatorial | Phil Scott won reelection with 55.2% | Phil Scott won reelection with 52.6% | Scott faced stiff headwinds from a much larger national blue wave, anti-incumbency rhetoric, and a degraded coalition due to his education reform proposals. |
Given the national and down-ballot blue wave, it was not crazy to think that Scott could lose, as all the necessary ingredients were there. Scott won reelection comfortably (52.6% to 45.9% over Amanda Janoo), but his margin was significantly compressed compared to his 2020 peak (68.5%) or 2022 performance (70.9%).
~59,000 fewer voters in 2026 than in 2024, and Scott had ~104,000 fewer votes than in 2024. Scott’s winning coalition in Vermont requires 100% Republican turnout and significant ticket splitting. Given the performance in down-ballot races, the majority of Scott’s typical margin of victory was eroded by his own Republican voter base staying home, with Janoo pulling some of the independent or Scott-Democrat votes her way; however, she finished around 30,000-60,000 votes behind the totals of other Democrats at the top of the ticket.
Janoo received 141,623 votes, trailing down-ballot statewide Democrats by 30,000 to 40,000 votes and highlighting significant ticket-splitting among moderate voters.
Working Against Scott | Working For Scott |
Degradation in his numbers comes down to;
“Anyone that’s blue” mentality | Scott is trusted on affordability and “no new taxes” messaging. Janoo was far too extreme for many voters: Anti/de-growth: Counter the "abundance" messaging, which has reached near-ubiquitous embrace. Higher taxes: Proposal would make the state have one of the highest marginal tax rates, starting at the lowest income threshold and turning off higher-earning ($250k+) dems. Housing: Didn’t see housing as a supply problem and focused heavily on taxation of second homes, which is already established legislative policy and precedent. |
Despite these factors, Scott’s lead was only 2.6% lower than in 2018, when a Democratic-progressive supermajority was first achieved.
Mind the (Enthusiasm) Gap: Turnout Indicators
We stated previously in communication that the levels of Democratic enthusiasm driving their base out to vote and Republican apathy that might keep their base home would likely shape the election: it did.
Based on an examination of “purple districts” that flipped parties in 2024 and then again in 2026.
Republican candidates saw 25% to 35% fewer votes.
Democrats only held or slightly increased their voter turnout from 2024 despite the national tailwind.
Looking back at polls:
As standard polling indicates, lower pre-election attention among party identifiers strongly correlates with lower turnout on Election Day. Pre-election polling from the UNH Survey Center showed a clear motivation gap: 69% of Democrats reported being "extremely interested" in the general election compared to 59% of Republicans, while 70% of Democrats reported paying a lot of attention compared to just 53% of Republicans.
Chittenden North Senate
This district indicates very clearly the impacts of 1) republicans not showing up to vote and 2) the toxicity of the Republican brand this year.
2024 | 2026 | Insight | |
Republican | Chris Mattos: 7,383 votes 56.0% | Ashley Bartley 5,475 votes 47.22% | 1,908 fewer republican votes than 2024. 25.8% drop among Republican voters accounted for |
Democrat | Irene Wrenner (D, Incumbent): 5,768 votes 43.8% | Irene Wrenner 5,718 49.31% | retained almost 99.1% of her 2024 vote baseline |
Total | 13,786 (25 blank) | 11,595 (372 blank) | 2,191 fewer votes cast in 2026 |
Near-Perfect Democratic Baseline Hold: While total participation in the district dropped by 2,191 ballots in the midterm environment, Irene Wrenner retained almost 99.1% of her 2024 vote baseline, losing only 50 votes total. Democratic base motivation remained virtually unchanged from the 2024 election cycle.
Lack of Republican Enthusiasm:The Republican candidate, Ashley Bartley, had 1,908 fewer votes compared to Chris Mattos's total in 2024. That 25.8% drop among Republican voters accounted.
Rise in Undervotes / Blanks: Blank votes increased from 25 in 2024 to 372 in 2026, indicating that even among voters who showed up for top-of-ticket races (such as the gubernatorial contest), a significant portion chose to leave the Senate line blank rather than cast a vote for the Republican candidate.
Franklin-3 District House Seat
This single-member district shows the distinct difference in voter enthusiasm and the effect of lower Republican voter turnout.
2024 | 2026 | Insight | |
Republican | Joe Luneau 1,125 votes 53.9% | Joe Luneau 756 votes 42.91% | 32.8% of 2024 Republican voters (369 out of 1,125) did not turn out or cast a vote for the GOP incumbent in 2026. |
Democrat | Mike McCarthy 955 votes 45.7% | Suzane Kenyon 966 votes 54.82% | Democratic voter turnout held steady at 101.1% of its 2024 baseline. |
Total | 2,088 votes (57 blank) | 1,762 (37 blank) | 326-voter total difference entirely felt by the Republican incumbent. |
Addison-3 District House Seats
This two-member district that had split representation as a result of the 2024 election also illustrates the difference in turnout rather clearly.
2024 | 2026 | Insight | |
Republican | Rob North (R): 2,679 votes (27.7%) Joseph Baker (R): 2,240 votes (23.2%) =4919 | Rob North 1,953 20.84% Joe Baker 1,677 17.90% = 3630 | 1289 less people voted republican. 26.20% decrease in raw Republican turnout. Rob = 726 fewer people voted for Rob |
Democrat | Matt Birong (D): 2,374 votes (24.6%) Diane Lanpher (D): 2,357 votes (24.4%) Total =4731 | John Stroup 2,665 28.44% Ariel Bolles 2,296 24.50% = 4961 | Democrats in Addison-3 actually expanded their raw vote count by 230 votes. Democratic voters turned out at over 104% of their 2024 turnout. |
Total | 9,663 votes | 9,370 | 293 fewer people voted |
In 2024, the Republicans led the combined vote total 4,919 to 4,731 (+188-vote GOP edge), allowing Rob North to secure one of the two seats. In 2026, the Democratic turnout growth combined with the apathetic GOP turnout drop created a 4,961 to 3,630 Democratic lead (+1,331 vote D edge), resulting in Democrats capturing both seats.